



by FIlmInk Staff
Australian highlights:
- IMAX generated more than US$6 million (A$8.6 million) in Australia during Q2, making it the company’s highest-grossing quarter ever in the market.
- The Odyssey delivered the biggest IMAX opening ever in Australia, earning more than US$1.1 million (A$1.6 million) from just 10 locations. Despite representing only a fraction of the country’s cinema screens, IMAX accounted for 12% of the national box office.
- The Melbourne Museum IMAX 70mm cinema was the highest-grossing IMAX location in Australia for The Odyssey, generating more than US$250,000 (A$350,000+) during its opening weekend.
Underscoring the power of its global platform, IMAX exceeds consensus expectations and posts strong year-over-year growth for the second quarter across key metrics:
-
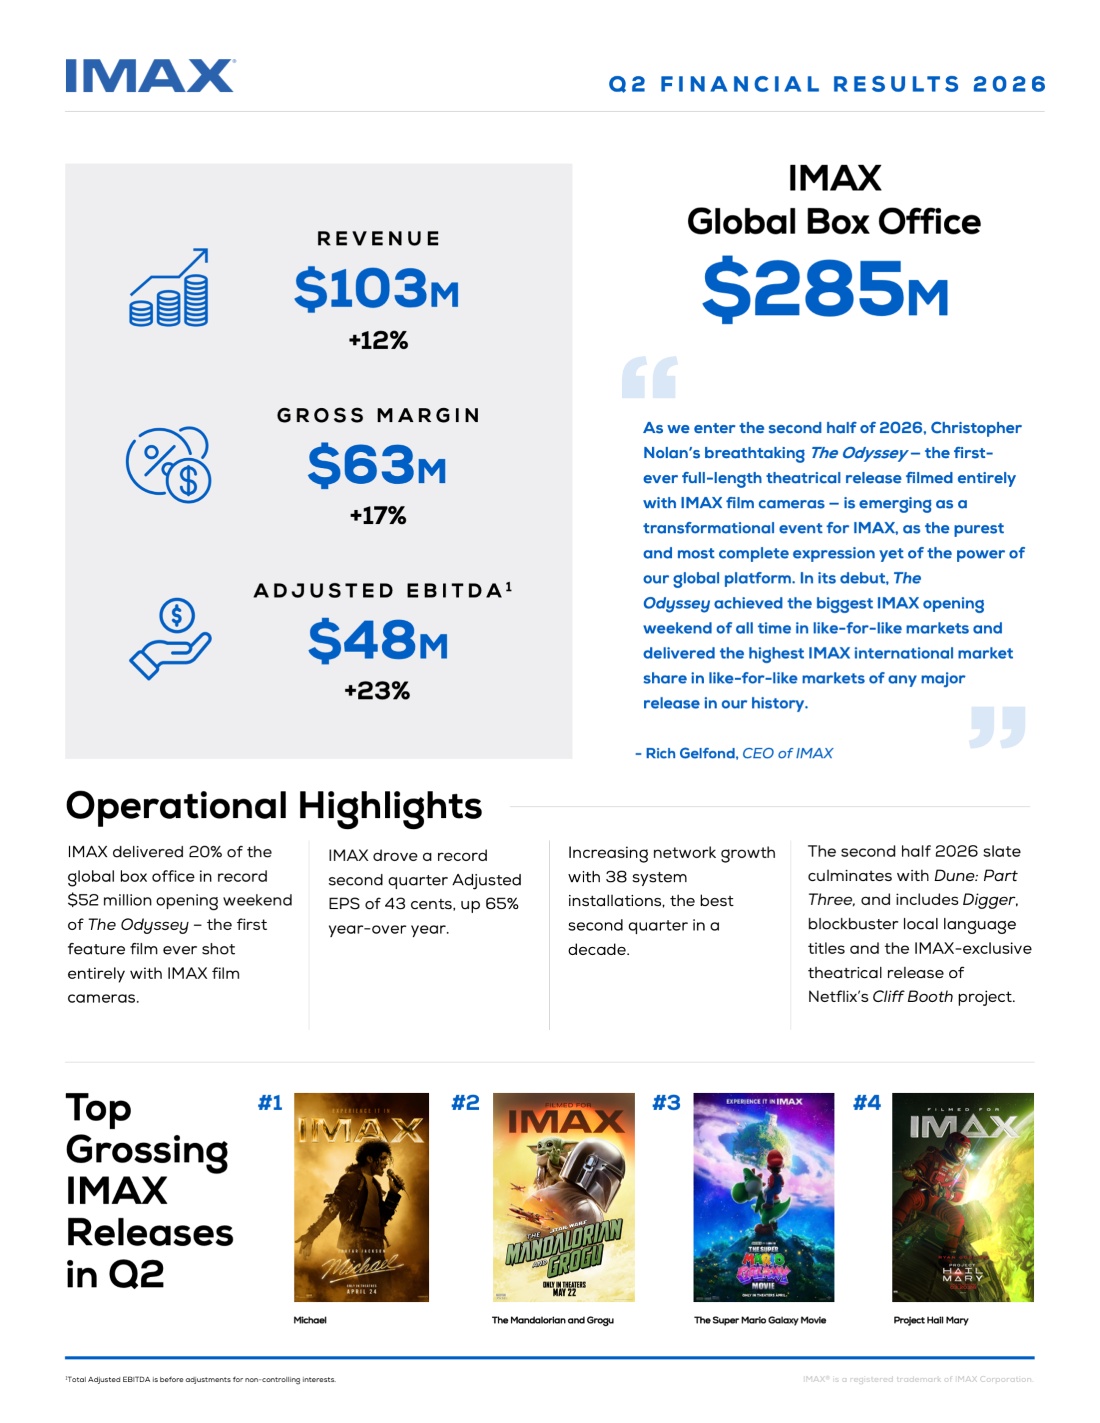
- Revenue of $103 million, up 12% year-over-year
- Strong operating profitability with Net Income margin of 15.5% and Adjusted EBITDA(3) margin of 46.6%
- Net income per diluted share of 27 cents, up 35% year-over year and record Q2 Adjusted EPS(2,3) of 43 cents, up 65% year-over-year
- Year-to-date Cash from Operating Activities of $36 million, up 19% year-over-year
- Amidst worldwide fan frenzy for IMAX, the Company delivers 20% of the global box office in record-breaking $52 million(1) opening weekend of Christopher Nolan’s The Odyssey – the first full-length theatrical release ever shot entirely with IMAX film cameras
- Record-breaking box office holds indicate historic IMAX run ahead for The Odyssey, with the Company achieving its highest grossing Monday and Tuesday ever and approximately $60 million in presales for future showtimes
- Network growth momentum continues, with highest Q2 installations (38) in a decade, and International excluding China network expansion of 9% year-over-year
- The Odyssey kicks off a stellar second half 2026 slate culminating with Denis Villeneuve’s Dune: Part Three and including Spider-man: Brand New Day (China, Japan and South Korea), Tom Cruise’s Digger, and the IMAX-exclusive theatrical release of Netflix’s Cliff Booth project, along with multiple local language blockbusters
IMAX Corporation (NYSE: IMAX) today reported strong financial results for the second quarter of 2026, demonstrating the value of its unique global entertainment platform and broad content portfolio.
“As we enter the second half of 2026, Christopher Nolan’s breathtaking The Odyssey — the first-ever full-length theatrical release filmed entirely with IMAX film cameras — is emerging as a transformational event for IMAX, as the purest and most complete expression yet of the power of our global platform,” said Rich Gelfond, CEO of IMAX. “In its debut, The Odyssey achieved the biggest IMAX opening weekend of all time in like-for-like markets(1) and delivered the highest IMAX international market share in like-for-like markets of any major release in our history.”
“The Odyssey has the potential to impact our business in many ways that are clear — and many ways we can’t yet predict, as its success on our platform reverberates across the creative community, and throughout the entertainment landscape. In the near-term, the film gives us excellent momentum as we enter the second half of the year, with a strong slate that culminates with Dune: Part Three, which was also shot with IMAX film cameras and will be presented in IMAX 70mm film.”
“We are very pleased with our strong results for the second quarter — in which we handily beat consensus estimates across key financial metrics — and look forward to building on our momentum to deliver global box office growth, network expansion worldwide, new opportunities for our brand and continued value for our shareholders.”
_______________
- IMAX global box office for The Odyssey does not include box office in South.Korea, Mainland China and Japan which open The Odyssey on Aug 5, Aug 14 and Sep 11, respectively.
- Attributable to common shareholders.
- Non-GAAP Financial Measure. See the discussion at the end of this earnings release for a description of the non-GAAP financial measures used herein, as well as reconciliations to the most comparable GAAP amounts.
Second Quarter Financial Highlights
| Three Months Ended June 30,
(Unaudited) |
Six Months Ended June 30,
(Unaudited) |
||||||||||||||||||||||||||||||||||||||||||||||||||||||||||||||||||||||||||||||||||||||||||||||||||||||||||||||||||||||||||||||||||
| In millions of U.S. Dollars, except per share data | 2026 | 2025 | YoY % Change |
2026 | 2025 | YoY % Change |
|||||||||||||||||||||||||||||||||||||||||||||||||||||||||||||||||||||||||||||||||||||||||||||||||||||||||||||||||||||||||||||
| Total Revenue | $ 102.8 | $ 91.7 | 12% | $ 184.2 | $ 178.4 | 3% | |||||||||||||||||||||||||||||||||||||||||||||||||||||||||||||||||||||||||||||||||||||||||||||||||||||||||||||||||||||||||||||
| Gross Margin | $ 62.9 | $ 53.6 | 17% | $ 108.7 | $ 106.8 | 2% | |||||||||||||||||||||||||||||||||||||||||||||||||||||||||||||||||||||||||||||||||||||||||||||||||||||||||||||||||||||||||||||
| Gross Margin (%) | 61.2 % | 58.5 % | 270bps | 59.0 % | 59.9 % | (90bps) | |||||||||||||||||||||||||||||||||||||||||||||||||||||||||||||||||||||||||||||||||||||||||||||||||||||||||||||||||||||||||||||
| Net Income | $ 15.9 | $ 12.2 | 30% | $ 22.0 | $ 20.4 | 8% | |||||||||||||||||||||||||||||||||||||||||||||||||||||||||||||||||||||||||||||||||||||||||||||||||||||||||||||||||||||||||||||
| Net Income Margin (%) | 15.5 % | 13.3 % | 220bps | 11.9 % | 11.4 % | 50bps | |||||||||||||||||||||||||||||||||||||||||||||||||||||||||||||||||||||||||||||||||||||||||||||||||||||||||||||||||||||||||||||
| Net Income Attributable to Common Shareholders | $ 15.4 | $ 11.3 | 36% | $ 19.6 | $ 13.6 | 44% | |||||||||||||||||||||||||||||||||||||||||||||||||||||||||||||||||||||||||||||||||||||||||||||||||||||||||||||||||||||||||||||
| Net Income Per Share – Diluted(1) | $ 0.27 | $ 0.20 | 35% | $ 0.35 | $ 0.25 | 40% | |||||||||||||||||||||||||||||||||||||||||||||||||||||||||||||||||||||||||||||||||||||||||||||||||||||||||||||||||||||||||||||
| Total Adjusted EBITDA(2)(3) | $ 48.0 | $ 39.1 | 23% | $ 78.5 | $ 76.0 | 3% | |||||||||||||||||||||||||||||||||||||||||||||||||||||||||||||||||||||||||||||||||||||||||||||||||||||||||||||||||||||||||||||
| Total Adjusted EBITDA Margin (%)(2)(3) | 46.6 % | 42.6 % | 400bps | 42.6 % | 42.6 % | —bps | |||||||||||||||||||||||||||||||||||||||||||||||||||||||||||||||||||||||||||||||||||||||||||||||||||||||||||||||||||||||||||||
| Adjusted Net Income(1)(2) | $ 24.2 | $ 14.6 | 66% | $ 33.8 | $ 21.8 | 55% | |||||||||||||||||||||||||||||||||||||||||||||||||||||||||||||||||||||||||||||||||||||||||||||||||||||||||||||||||||||||||||||
| Adjusted Earnings Per Share – Diluted(1)(2) | $ 0.43 | $ 0.26 | 65% | $ 0.60 | $ 0.40 | 50% | |||||||||||||||||||||||||||||||||||||||||||||||||||||||||||||||||||||||||||||||||||||||||||||||||||||||||||||||||||||||||||||
| Weighted average shares outstanding (in millions): | |||||||||||||||||||||||||||||||||||||||||||||||||||||||||||||||||||||||||||||||||||||||||||||||||||||||||||||||||||||||||||||||||||
| Basic | 55.0 | 53.8 | 2% | 54.5 | 53.4 | 2% | |||||||||||||||||||||||||||||||||||||||||||||||||||||||||||||||||||||||||||||||||||||||||||||||||||||||||||||||||||||||||||||
| Diluted | 56.6 | 55.2 | 3% | 56.5 | 55.1 | 3% | |||||||||||||||||||||||||||||||||||||||||||||||||||||||||||||||||||||||||||||||||||||||||||||||||||||||||||||||||||||||||||||
| (1) Attributable to common shareholders.
(2) Non-GAAP Financial Measure. See the discussion at the end of this earnings release for a description of the non-GAAP financial measures used herein, as well as reconciliations to the most comparable GAAP amounts. (3) Total Adjusted EBITDA is before adjustments for non-controlling interests. Total Adjusted EBITDA per Credit Facility attributable to common shareholders, excluding non-controlling interests, was $45.6 million and $72.4 million for the three and six months ended June 30, 2026, respectively (2025 – $36.7 million and $65.7 million, respectively). The Company’s Credit Facility covenant is calculated on a trailing twelve-month basis. Second Quarter Segment Results(1)
Content Solutions Segment
Technology Products and Services Segment
Operating Cash Flow and Liquidity Net cash provided by operating activities for first half 2026 increased 19% year-over-year to $36 million, reflecting higher operating profits and improvements in working capital driven by higher collections. As of June 30, 2026, the Company’s available liquidity was $551 million. The Company’s liquidity included cash and cash equivalents of $160 million, $334 million in available borrowing capacity under the Company’s revolving credit facility, and $57 million in available borrowing capacity under IMAX China’s revolving facilities. Total debt, excluding deferred financing costs, was $292 million as of June 30, 2026. In 2025, the Company issued $250 million of 0.750% Convertible Senior Notes due 2030 (“2030 Convertible Notes”). In connection with the pricing of the 2030 Convertible Notes, the Company entered into privately negotiated capped call transactions with an initial cap price of $57.10 per share of the Company’s common shares.
|
|||||||||||||||||||||||||||||||||||||||||||||||||||||||||||||||||||||||||||||||||||||||||||||||||||||||||||||||||||||||||||||||||||
